
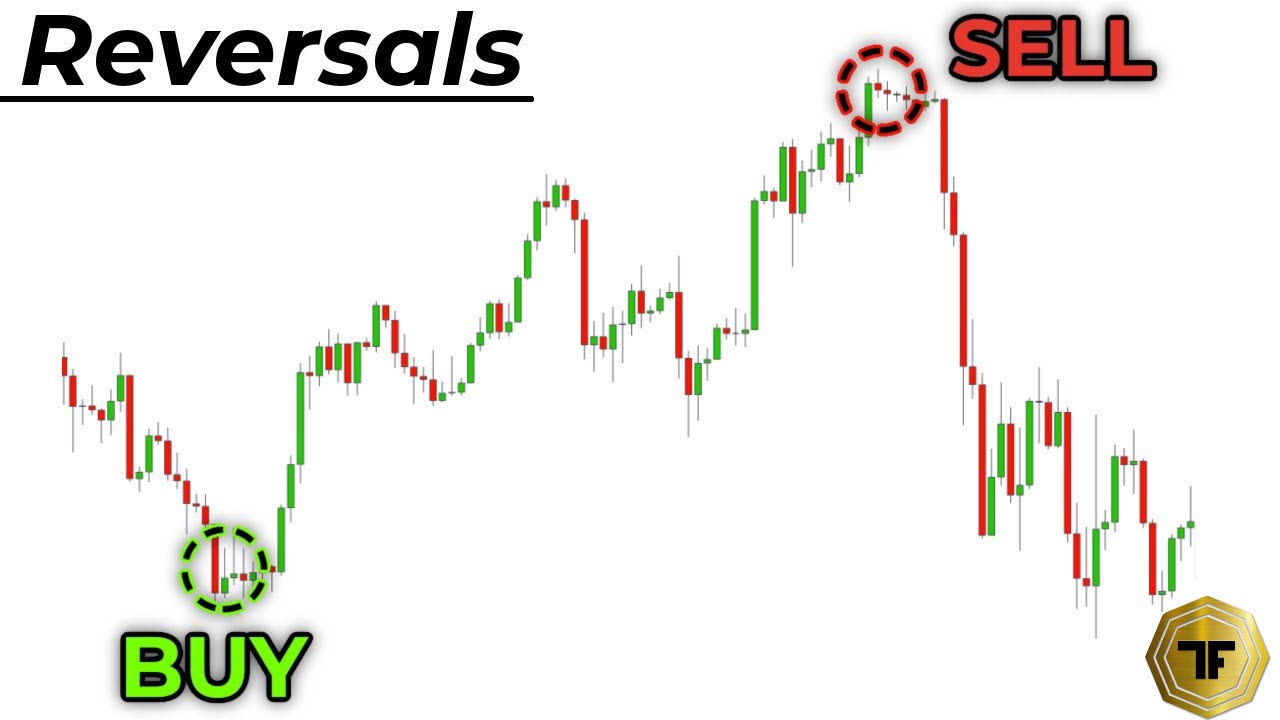

A trend reversal marks the point where a sustained price movement ends and a new one begins in the opposite direction. For futures traders, this moment presents both high risk and great opportunity: if detected early and with solid confirmation, it offers one of the clearest possible entry points; if traded on the wrong side, leverage can turn a momentary miscalculation into a significant loss.
Learning to identify trend reversals before they fully unfold is one of the most valuable skills in futures trading. This guide explains what trend reversals are, how to distinguish them from pullbacks, which technical signals carry the most weight, and how NinjaTrader tools can help you act on them with greater confidence and precision.
What is a trend reversal in futures trading?
A trend reversal in futures occurs when the price shifts from a sustained direction to the opposite one, ending a previous uptrend or downtrend and initiating a new one. Unlike a pullback—a temporary move against the main trend that eventually resolves in the original direction—a trend reversal signals a more fundamental shift in market sentiment.
Uptrend reversal vs. downtrend reversal defined
A bullish trend reversal occurs when a market that was posting higher highs and higher lows begins to record lower highs and lower lows. Sellers step in forcefully, and the price begins a new downward trajectory.
Conversely, a bearish trend reversal is its mirror image: a market that was gradually declining suddenly finds support, buyers take control, and the price begins forming higher lows and higher highs.
Why recognizing trend reversals is important for real-time traders
In futures markets, leverage amplifies results, and prices move rapidly. Trading a trend reversal on the wrong side can quickly lead to losses, but spotting it early—with solid confirmation—can offer one of the clearest entry opportunities in the market. Identifying trends in futures is the foundation; knowing when those trends end represents the next level.
The first step is understanding what constitutes a trend change; the most complex skill lies in learning to distinguish it from movements that merely appear to be one.
Reversal vs. pullback: why this distinction is key for beginners
The difference between a trend reversal and a pullback is the most important distinction in technical analysis for novice traders, and also the one most frequently misinterpreted.
- Trend reversal: a structural shift in the trend’s direction. The previous trend ends, and a new one begins.
- Pullback: a temporary movement against the trend that ultimately resolves in the original direction.
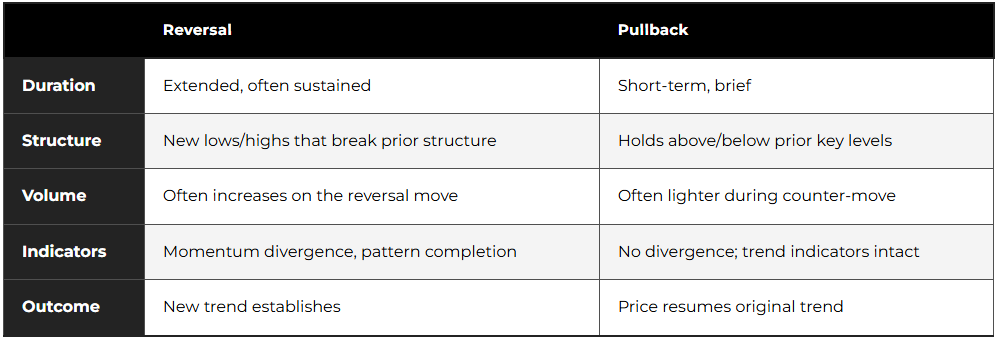
The distinction becomes clearer when comparing them directly:
How to tell if a move is a true reversal or just noise
Used together, these signals can help you determine which side of that line a movement falls on.
- Break of previous structure: In an uptrend, a reversal usually involves the price breaking below a previous significant low; pullbacks do not.
- Volume expansion: Reversals tend to be accompanied by above-average volume. A price drop on low volume is more likely to be a pullback.
- Indicator divergence: When the price reaches a new high but the RSI or MACD fails to confirm it, the uptrend may be weakening.
- Pattern completion: Once the price breaks the neckline of a reversal pattern (head and shoulders, double top/bottom), the reversal signal is confirmed.
When these signals converge, the probability of a reversal increases; when they do not, the movement is more likely a pullback, and it is best to wait for it to end.
Common mistakes beginners make when misinterpreting the price action
The most common mistake? Assuming that any pullback represents a reversal. Traders see the price fall by 10 ticks, assume the trend has ended, and open short positions just before a brief pause—after which the price rises again. The solution: wait for confirmation.
A single candle moving against the trend does not constitute a reversal. A pattern—backed by volume and indicator signals—is the closest thing to one.
Master the difference between a reversal and a pullback, and you will have eliminated one of the most common errors.
Key signals for identifying a trend reversal
Futures traders often use multiple technical signals to identify reversals, including candlestick patterns like hammers and engulfing candles, chart formations such as head-and-shoulders or double tops, and divergences in momentum indicators like the RSI or MACD.
None of these signals works in isolation; their effectiveness lies in using them in combination.
Candlestick reversal patterns (hammer, shooting star, engulfing)
- Hammer: Forms at the end of a downtrend. A long lower shadow indicates that buyers absorbed selling pressure; a potential bullish reversal.
- Shooting Star: Forms at the end of an uptrend. A long upper shadow indicates that sellers rejected higher prices; a potential bearish reversal.
- Bullish Engulfing Pattern: A large green candle completely engulfs the previous red candle, indicating that buying pressure is overcoming selling pressure.
- Bearish Engulfing Pattern: The opposite; sellers take control.
Candlestick patterns are most significant at key support and resistance levels, or following a prolonged move in one direction.
Chart patterns: head and shoulders, double top, and double bottom
The head-and-shoulders pattern is one of the most recognized reversal formations. It forms following an uptrend: a peak (left shoulder), a higher peak (head), and a lower peak (right shoulder). A break below the neckline confirms the reversal.
Key Term
Neckline: in a head and shoulders pattern, the support level drawn by connecting the lows between the left shoulder, head, and right shoulder. A confirmed close below the neckline signals a bearish reversal.
Double top and double bottom patterns are easier to identify: two failed attempts to break past the same resistance (or support) level, indicating that the market cannot continue in its previous direction.
A simple explanation of RSI and MACD divergence
Divergence occurs when price and an indicator move in opposite directions.
Key term
Divergence: occurs when the price hits a new high or low that is not confirmed by a momentum indicator such as the RSI or MACD. Bullish divergence (price hits lower lows while the indicator hits higher lows) can signal a potential upward reversal. Bearish divergence (price hits higher highs while the indicator hits lower highs) can signal a potential downward reversal.
When MACD or RSI divergence coincides with a candlestick pattern or a key resistance level, the probability of a reversal increases significantly.
Volume confirmation: why it matters before entering a trade
Volume is the fuel that drives price movements. A reversal accompanied by volume indicates conviction; a low-volume reversal is suspect. Before acting, check if volume is increasing on the reversal candles. Experienced traders rarely rely solely on pattern signals.
No single signal defines a reversal trade. Candlestick patterns offer the first visual clue, chart formations provide structural confirmation, divergence indicates that momentum is fading, and volume reveals whether there is genuine conviction behind the move. When two or more of these factors align at the same price level, you move beyond speculation and begin to build a solid case.
How to Use NinjaTrader to Trade Reversals More Effectively
The NinjaTrader platform allows futures traders to overlay multiple reversal indicators (such as Parabolic SAR, RSI, and moving averages) on a single chart, making it easier to confirm signals before opening a trade.
Drawing Trendlines and Marking Support and Resistance on Charts
Before adding indicators, analyze the market structure: in the NinjaTrader chart window, use the “Draw” menu to plot trendlines connecting significant highs and lows (swings) and add horizontal lines at key support and resistance levels. Reversals do not occur at random; they happen at significant levels. Identifying trends using moving averages also helps determine the prevailing trend before looking for a change in direction.
Incorporating and configuring reversal indicators (Parabolic SAR, RSI, MACD)
Right-click on any NinjaTrader chart and select “Indicators” to add the Parabolic SAR, RSI, and MACD from the library. Default settings serve as a good starting point for beginners.
The Parabolic SAR indicator on NinjaTrader charts visually signals a potential trend reversal by shifting its dots from below the price to above it (or vice versa), offering beginners a clear, easy-to-interpret signal. With the RSI and MACD displayed in separate panels below the price, you can visually spot divergences without needing to perform mathematical calculations. When all three signals align at the same level, some traders view this as a stronger technical confirmation.
When the Parabolic SAR changes direction, the RSI shows a divergence, and the MACD crosses over—all at the same key level—this is not merely market noise; some traders may interpret it as a potentially significant market signal.
Using ATM strategies to ensure hesitation-free exits
Beginner futures traders can use NinjaTrader’s built-in ATM (*Advanced Trade Management*) strategies to automatically place stop-loss and profit-target orders the moment a reversal trade is opened, thereby avoiding the need to manage exits manually under pressure.
In the order entry panel, select the “ATM Strategy” drop-down menu, choose a template or create a custom one, and NinjaTrader will handle both exit orders. You define the risk before entering the trade and then execute it.
Practical tips for trading reversals with greater precision
Identifying a reversal is one skill; acting on it consistently is quite another.
Confirmation via multiple indicators: do not rely on a single signal
An isolated reversal signal is an indication, not a definitive conclusion. Review this checklist before entering a trade:
- Does a reversal candlestick pattern appear at a key level?
- Does the Parabolic SAR indicator confirm a change in direction?
- Is there divergence on the RSI or MACD?
- Does volume increase on the reversal candle(s)?
- Is the price breaking a significant prior structural level?
Are four or five of these conditions met? That’s a strong signal. Only one? You better wait.
Choosing a timeframe for beginners (which charts to start with)
Constantly switching timeframes can lead to conflicting signals. Keep it simple: use a 15-minute chart for entry signals and pattern recognition, and a 5-minute chart to fine-tune the exact moment of entry. Avoid charts with timeframes shorter than one minute until your pattern recognition skills are solid; they generate a lot of “noise,” making it nearly impossible to distinguish a reversal from random price movement.
Setting the stop-loss at the right level for reversal trades
In futures, risk management —where leverage amplifies every move— stop orders are not optional. For reversal trades, place your stop above the high of a bearish pattern (or below the low of a bullish pattern): right at the point where your reversal thesis is invalidated.
In reversal trading, the stop-loss serves not only to limit losses but to define the exact point where your analysis is proven incorrect. Place it where the thesis is no longer valid.
How to practice risk-free reversal trading on the NinjaTrader simulator
NinjaTrader’s comprehensive trading simulator features real-time market data, allowing beginners to practice identifying and executing reversal trades under real market conditions without risking capital. NinjaTrader’s live-data simulation mode provides real-time market information, allowing you to make decisions just as you would if real money were at stake. Use it to practice spotting patterns as they form, test your ATM strategy settings, and build the habit of acting on signals without hesitation. Most importantly, use it to catch your mistakes before they cost you money.
Author: NinjaTrader