
Dale Langer, the trader and educator behind Trader Dale, has been trading the markets since 2008 and has developed an approach based on volume profile, order flow, and Volume-Weighted Average Price (VWAP). In this session for the NinjaTrader Ecosystem, he broke down the three-step process he uses to identify strong support and resistance zones and determine the precise moment to enter them, using E-mini S&P 500 (ES) and E-mini Nasdaq-100 (NQ) futures as practical examples.
Langer deliberately limited the scope of the presentation. Instead of addressing topics like position sizing, capital management, or trading psychology, he focused exclusively on market entries so that viewers would walk away with a complete method rather than a disjointed mix of ideas. The framework boils down to two questions: where should a trader look for a trade, and when should they execute it? Volume profile answers the first question; order flow answers the second.
Volume Profile Fundamentals: Identifying Where Big Money Trades
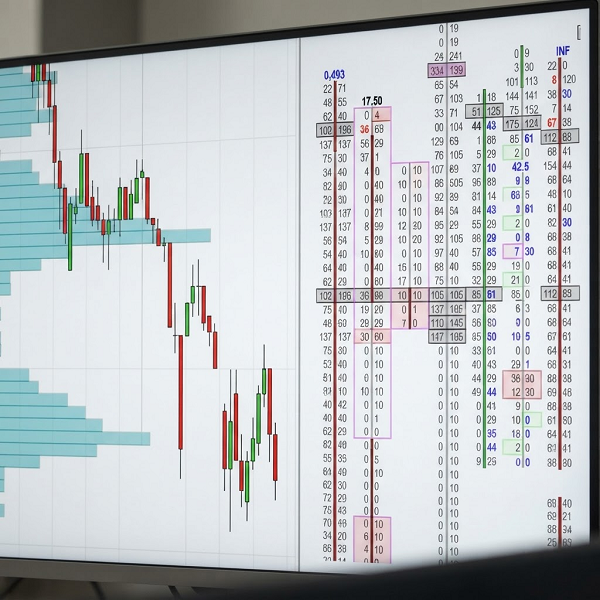
Volume profile is a histogram representing volume based on price rather than time. A wide bar in the profile indicates high volume traded at that price; Langer views these high-volume areas as strong support and resistance zones, as they signal where institutions executed the bulk of their trades. That fundamental concept forms the basis of his entire strategy.
He constructs these zones using a custom indicator called the *Flexible Volume Profile*—so named because it can be repositioned anywhere on the chart rather than being restricted to a fixed session or date range. This is crucial to his approach, as he is not interested in daily or weekly volume profiles for this setup, but rather in how volume is distributed within a specific trend.
- A high-volume area is a zone, not a single price level, and price can react at any point within it.
- Langer performs this analysis exclusively on 30-minute charts to observe the overall trend, thereby avoiding the noise inherent in faster time-frame charts.
The trend setup: trading pullbacks to untested volume zones
The setup Langer uses most frequently—termed the “trend setup”—begins on the 30-minute chart. He identifies a clear trend and then uses the volume profile to locate volume clusters that stand out specifically within that trend, rather than considering the profile of the entire session or the week. He noted that it is best to avoid clusters that are too wide to pinpoint a specific price, as the resulting zone becomes too imprecise for confident trading.
Once a cluster is identified, he waits for the price to move away and then pull back toward it—specifically on the first test—to trade in the direction suggested by the trend: a short position on a pullback to resistance in a downtrend, or a long position on a pullback to support in an uptrend. He remarked that he does not dismiss levels simply because they are old; in his experience, markets tend to “remember” untested zones even weeks later, though he clarified that this is an observation based on years of trading rather than something verified through data-backed backtesting.
To illustrate this, he presented two examples of downtrends in the same market: one featuring two clear volume clusters that generated two short trades following respective pullbacks, and another with three clusters, one of which he completely disregarded because it was too wide to trade clearly.
Order flow: three ways to determine timing and confirm the entry
Once the volume profile zone is marked, Langer switches to a 5-minute “footprint” chart to determine the exact moment of entry. His footprint configuration colors each cell green or red depending on whether buyers or sellers showed greater aggression, using darker shades to indicate higher volume. This design allows you to interpret market action at a glance, without having to analyze individual figures. It looks for one of three confirmation signals, and the occurrence of any one of them is sufficient to trade within a solid zone. In all three cases, the signal is valid only if it occurs within a marked support or resistance zone; outside of that zone, it is considered merely market noise.
Absorption
Within a support or resistance zone, Langer observes whether unusually high volume occurs on both the buy (*bid*) side and the ask price within the same footprint cells simultaneously. When this happens, the price tends to stall because the pressure from one side is absorbed by the other—for example, when buyers push toward a resistance level and encounter sellers strong enough to halt the advance. He clarified that what constitutes unusually high volume depends entirely on the instrument and the trading session; there is no universal threshold for the contract—the benchmark is simply the typical volume for that market at that time of day.
Delta changes
Delta is the difference between the volume traded at the ask price and the volume traded at the bid price within a specific footprint cell: a positive delta indicates that aggressive buyers are dominant, while a negative delta signals the dominance of aggressive sellers. Langer looks for a shift in delta just as the price reaches a marked zone—for instance, seeing the delta remain positive while the price rises and then flip to negative at the resistance level, indicating that sellers have taken control exactly where he expected them to.
Large orders
For this setup, Langer filters the order flow display to hide anything below a minimum trade size, ensuring that only large individual orders appear. His thresholds vary by market and change over time; currently, he notes, they are 300 contracts for the ES, 50 for the NQ, and 70 for Euro futures. When a large order is recorded within a marked zone—whether on the bid or ask side—he interprets it as confirmation that a large trader or institution is defending that specific level. The only limitation, he added, is that this method cannot detect iceberg orders split into smaller parts, as only a single visible order is recorded.
A single confirmation suffices to trade within a well-defined zone, but Langer noted that the more of these three factors align, the stronger the signal to enter the trade.
Stacking confirmations: a real-world Euro futures trade
Langer stated that one confirmation is enough in a well-defined zone, though he waits for two or three when dealing with levels he is less certain about. He described a real trade his members executed in Euro futures to illustrate what the three confirmations look like together. During a 30-minute downtrend, he had marked a resistance zone based on a volume cluster; when the price retraced to that level, three conditions triggered simultaneously: high volume on both sides (absorption), a shift from positive to negative delta, and a large order recorded within the zone. He described the situation as a near-ideal setup, prompting the opening of a short position.
A footprint reading tip for cluttered charts: cell merging
For markets like the NQ, where a raw footprint chart can become so dense it is unreadable, Langer uses a setting called “tick aggregation” to combine multiple cells into one; he noted that NinjaTrader’s order flow tools offer a similar “cell merging” option. He applies a 2-cell aggregation to Euro and ES futures, and 10 to 20 cells to the NQ, precisely because of the higher granularity in the latter’s raw footprint. Beyond improving readability, he pointed out that the aggregated view consumes fewer computing resources.
Frequently Asked Questions
What time period should the volume profile cover?
The duration of the trend is less important than determining which part of it the price is realistically likely to revisit; the focus is often placed exclusively on the last day or the last two days, rather than analyzing a multi-day trend in its entirety.
Can a fully confirmed trade fail?
Yes, and it happens frequently, even with setups that meet all the requirements. The goal is not to achieve a perfect win rate, but rather to ensure that winning trades outnumber losing ones in the long run.
Which session works best?
Ideally, the US session and the overlap period between the European and US sessions, due to liquidity; conversely, avoid trading the Asian session when using order flow.
As always, education and risk management come first. View the full details.