

How is volatility used in technical analysis of the futures markets?
Although technical analysis is primarily concerned with when to enter and when to exit a trade, the study of volatility can also help traders identify trading opportunities in the futures markets.
Volatility is the tendency for price to change—that is, how much can we expect the price of a market to go up or down? It is typically calculated using statistical methods that track the variance of prices over time. In other words, what is the magnitude of price moves and how often does the price change direction?
Popular price volatility indicators to analyze the futures markets
Average True Range (ATR)
When reviewing a price chart, the “range” of a bar (high price minus low price) provides a view of volatility, with larger range bars indicating higher levels of volatility. Futures traders often use a more robust calculation called “True Range,” which includes the close of the previous bar.
The Average True Range (ATR) indicator averages the True Range of each bar over a specified number of lookback bars throughout the chart.
- When the indicator is moving upward, volatility is increasing
- When the indicator is moving down, volatility is decreasing.
By default, the ATR indicator value is the average of True Range for 14 lookback bars and indicates the potential price movement for each bar moving forward.
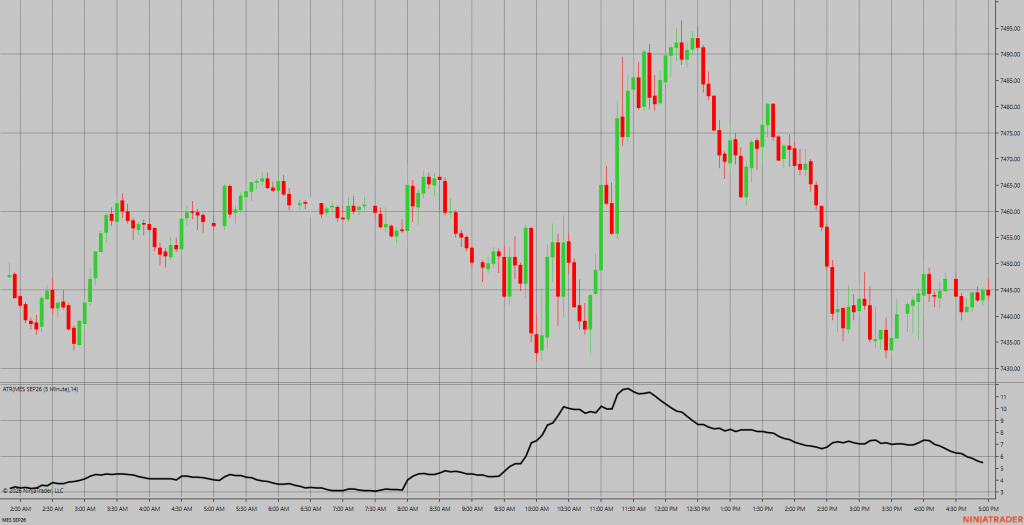
Micro-SP500 (MES) with ATR
Keltner Channels
Keltner Channels are a widely used volatility-based indicator that utilizes the average true range calculation to create bands around the bars that can serve as support and resistance levels.
Keltner Channels are an effective way to visualize increasing and decreasing volatility.
- When the bands are widening, volatility is increasing, and the trend may be strengthening
- When the bands are narrowing, volatility is decreasing, and the trend may be weakening.
In addition, Keltner Channels can be used to indicate where prices tend to pause or reverse. If prices break out from those levels, they can also signal a new or continuing price trend.
The default parameters for Keltner Channels are a 20-bar average with 1.5 ATRs up and down, but these settings can be modified to best fit the market being traded.
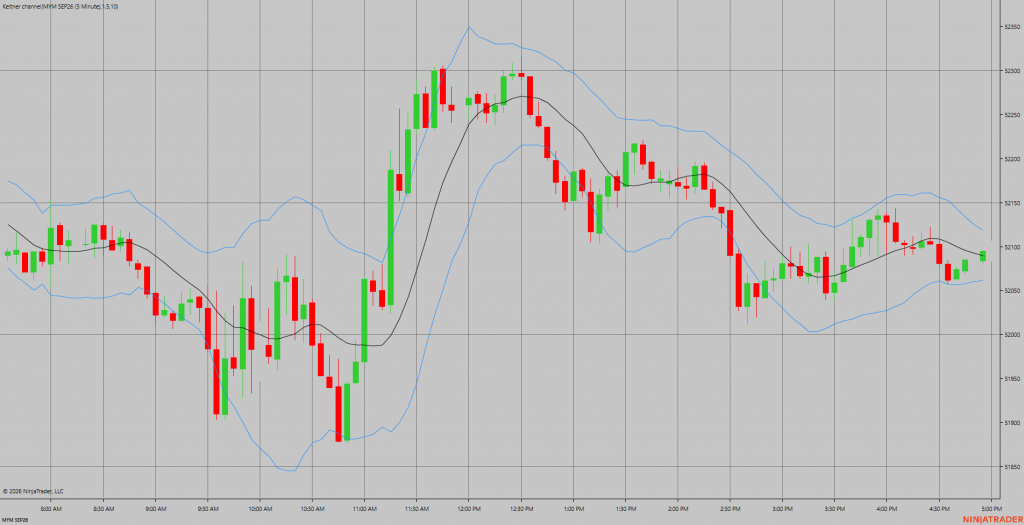
Micro-Dow Jones (MYM) with Keltner Channels
Bollinger Bands
Bollinger Bands are a popular statistical indicator that uses a standard deviation calculation to create price bands around a moving average. Bollinger Bands tend to be more reactive to recent market conditions and are often used to identify when prices are overbought, near the upper band, or oversold, near the lower band.
Although the upper and lower bands are considered support and resistance levels, when the market is trending, prices can move along the bands until the trend ends or reverses.
Bollinger Bands are an effective way to visualize increasing and decreasing volatility.
- When the bands are widening, volatility is increasing, and the trend may be strengthening
- When the bands are narrowing, volatility is decreasing, and the trend may be weakening.
- There can often be a change of trend direction when Bollinger Bands are at their widest.
The default parameters for Bollinger Bands are a 20-bar center moving average with two standard deviations up and down creating the bands. Bollinger Bands can be applied in any timeframe, from minute bars to daily, weekly, or monthly bars.
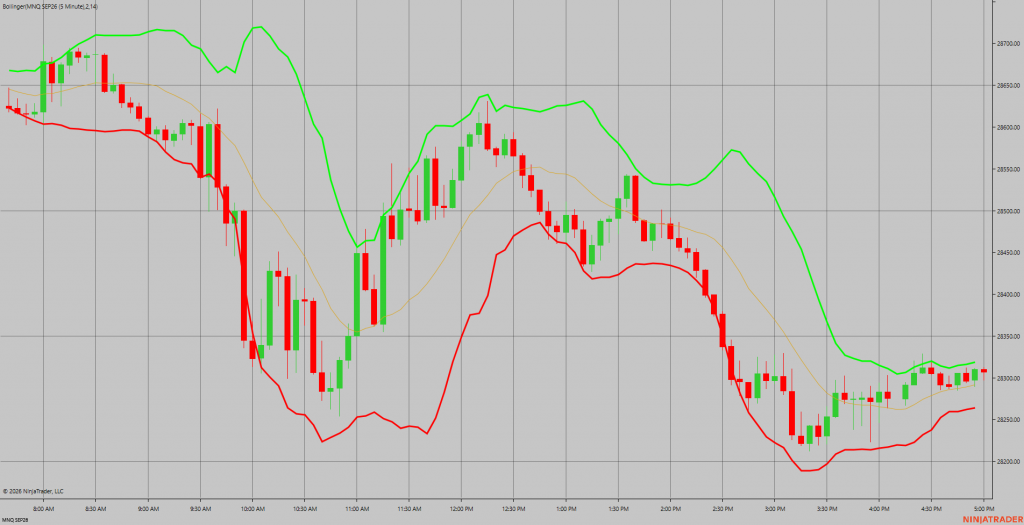
Micro-Nasdaq (MNQ) with Bollinger Bands
Add Volatility Indicators to Futures Trading Charts With Your Free NinjaTrader Account
Volatility indicators like average true range or ATR and Bollinger Bands can be applied directly to a futures price chart at any timeframe, allowing for shorter- to longer-term analysis.
NinjaTrader’s comprehensive trading simulator features real-time market data, allowing beginners to practice identifying and executing volatility trades under real market conditions without risking capital. NinjaTrader’s live-data simulation mode provides real-time market information, allowing you to make decisions just as you would if real money were at stake. Use it to practice spotting patterns as they form, test your ATM strategy settings, and build the habit of acting on signals without hesitation. Most importantly, use it to catch your mistakes before they cost you money.
Author: NinjaTrader