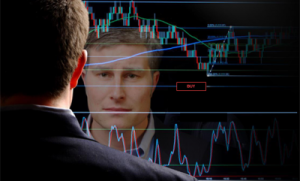


This is completely normal in futures markets, and what you are observing is one of the most important concepts in order flow analysis and professional trading.
Here is the reason why you see strong selling activity while the price rises (and strong buying activity while it falls):
1. Market Makers / Liquidity Providers
- They constantly sell when the market shows strength (rises) and buy when it shows weakness (falls).
- Their function is to provide liquidity on both sides of the market. When the market experiences a strong bullish rally, they sell futures contracts to aggressive buyers. This generates the high volume of “sold contracts” you are observing.
- They aim to maintain a relatively neutral position and profit from the spread (price differential) plus rebates.
2. Profit Taking + Position Closing
- Many traders and institutions holding long positions (bought at lower levels) take advantage of the upward movement to lock in profits. They are selling, but the strength of new buyers is greater.
- This generates high selling volume, even as the price continues its gradual ascent.
3. Hedging Activity
- Major market players (asset managers, ETFs, pension funds, etc.) often use futures to hedge their stock portfolios.
- As the cash market rises, they may sell index futures to maintain a market-neutral position or to reduce risk exposure.
4. Short Sellers (“Fading the Move”)
- Traders employing mean-reversion strategies, as well as certain algorithms, sell during upward moves in anticipation of trend exhaustion.
- Many of these short sellers end up getting run over by the market, which adds fuel to the bullish trend when they are finally forced to close their positions (cover).
5. Absorption
- This is the key concept. When you observe massive selling volume amidst an uptrend, it means buyers are absorbing all that selling pressure and still managing to push the price higher. In reality, this is a sign of strength, not weakness.
- The opposite occurs in downtrends: high buying volume is absorbed by sellers whose strength is even greater.
Real-World Context (especially in ES/NQ/CL)
In highly liquid futures markets, such as the S&P 500 (ES), it is very common to observe:
- More than 60–70% of the volume on the sell side during strong upward moves.
- Or more than 60–70% on the buy side during strong downward moves.
This happens because aggressive buyers execute their orders at the *ask* price, “lifting” the available offers, while sellers with limit orders accumulate at higher levels. The aggressive side is numerically smaller but more determined.
How smart traders use this:
- High selling volume + higher highs → bullish (absorption)
- High selling volume + inability to set new highs → bearish (selling pressure is winning)
- Look at Volume Delta (Cumulative Volume Delta or Delta Divergence) rather than just total volume.
This is why raw volume can be misleading: what matters is the imbalance at key levels, not the total number of contracts traded.
How do you determine the imbalance at key levels in the NQ? Identifying imbalances at key levels in the NQ (E-mini Nasdaq-100 futures) is one of the most powerful ways to read order flow. The NQ responds very well to this due to its heavy technology weighting, volatility, and excellent liquidity.
What “imbalance” means in this context
An imbalance occurs when buying or selling pressure at a specific price level is significantly stronger than that of the opposing side. This typically happens at:
- Previous highs/lows
- VWAP, session highs/lows, or daily/weekly levels
- Volume Profile Value Area High/Low (VAH/VAL) or Point of Control (POC)
- Round numbers or Fibonacci levels
Strong imbalances at these levels can indicate absorption (one side is consuming the other’s orders without significant price movement) or exhaustion.
The best tools for NQ order flow imbalances
Platforms popular among NQ traders:
- NinjaTrader (Order Flow +) — Volume bars / Footprint
- Sierra Chart — Numeric bars (excellent for futures)
- ATAS, Bookmap, Jigsaw, Quantower, or MotiveWave
- TradingView also features good footprint/volume imbalance indicators
How to spot imbalances on a Footprint chart (the most common method)
- Switch to Footprint / Volume bars (5-minute, 1-minute, or Range bars work well for the NQ).
- Diagonal comparison (the core of footprint reading):
- Compare the Ask volume (right side, aggressive buyers) at a specific price level with the Bid volume (left side, aggressive sellers) at the price level immediately below.
- Or vice versa.
Set an imbalance threshold:
Common settings: 300% (one side is three times the other); a good starting point for the NQ. More aggressive: 400–500% for clearer signals.
Platforms highlight these values automatically (green for buy imbalance, red for sell).
Example:
At a support level, you observe a price point with 450 contracts bought (*ask* volume) versus only 120 contracts sold (*bid* volume below) → Buy imbalance (bullish absorption).
Key patterns at important levels
Situation | What to look for | Interpretation for NQ
Support level | Strong buy imbalances + positive delta while price holds | Buyers are absorbing selling pressure → possible bounce
Resistance level | Strong sell imbalances + negative delta while price stalls | Sellers are absorbing buying pressure → possible rejection
Breakout | Stacked imbalances (multiple consecutive levels) in the direction of the breakout | High-probability continuation
Absorption | High volume (high delta) but little price movement | One side is strongly defending the level
Divergence | Price hits a new high, but Cumulative Volume Delta (CVD) weakens | Potential reversal
Additional ways to confirm an imbalance
- Cumulative Volume Delta (CVD): Watch for divergence between delta and price at key levels.
- Volume Profile + Delta: Look for high-volume nodes where delta flips sign.
- DOM (Depth of Market): Monitor large passive orders being executed or pulled.
- Stacked imbalances: Multiple consecutive imbalances in the same direction; a very strong signal.
Practical tips specific to the NQ
- The NQ moves rapidly: use tighter imbalance ratios (e.g., 250–300%) during periods of high volatility (news events, market open).
- Focus on key session levels (New York open, London close) and the previous day’s highs/lows.
- Combine analysis with Volume Profile: imbalances near the POC or the edges of the Value Area are more significant.
- Pay attention to absorption at extremes: strong selling pressure at a low that fails to break is a bullish signal.